Corporate Structure Chart Software Australia
Corporate structure chart software Australia: live entity charts for companies, trusts, SPVs, JVs, UBO chains, officeholders and ASIC records.
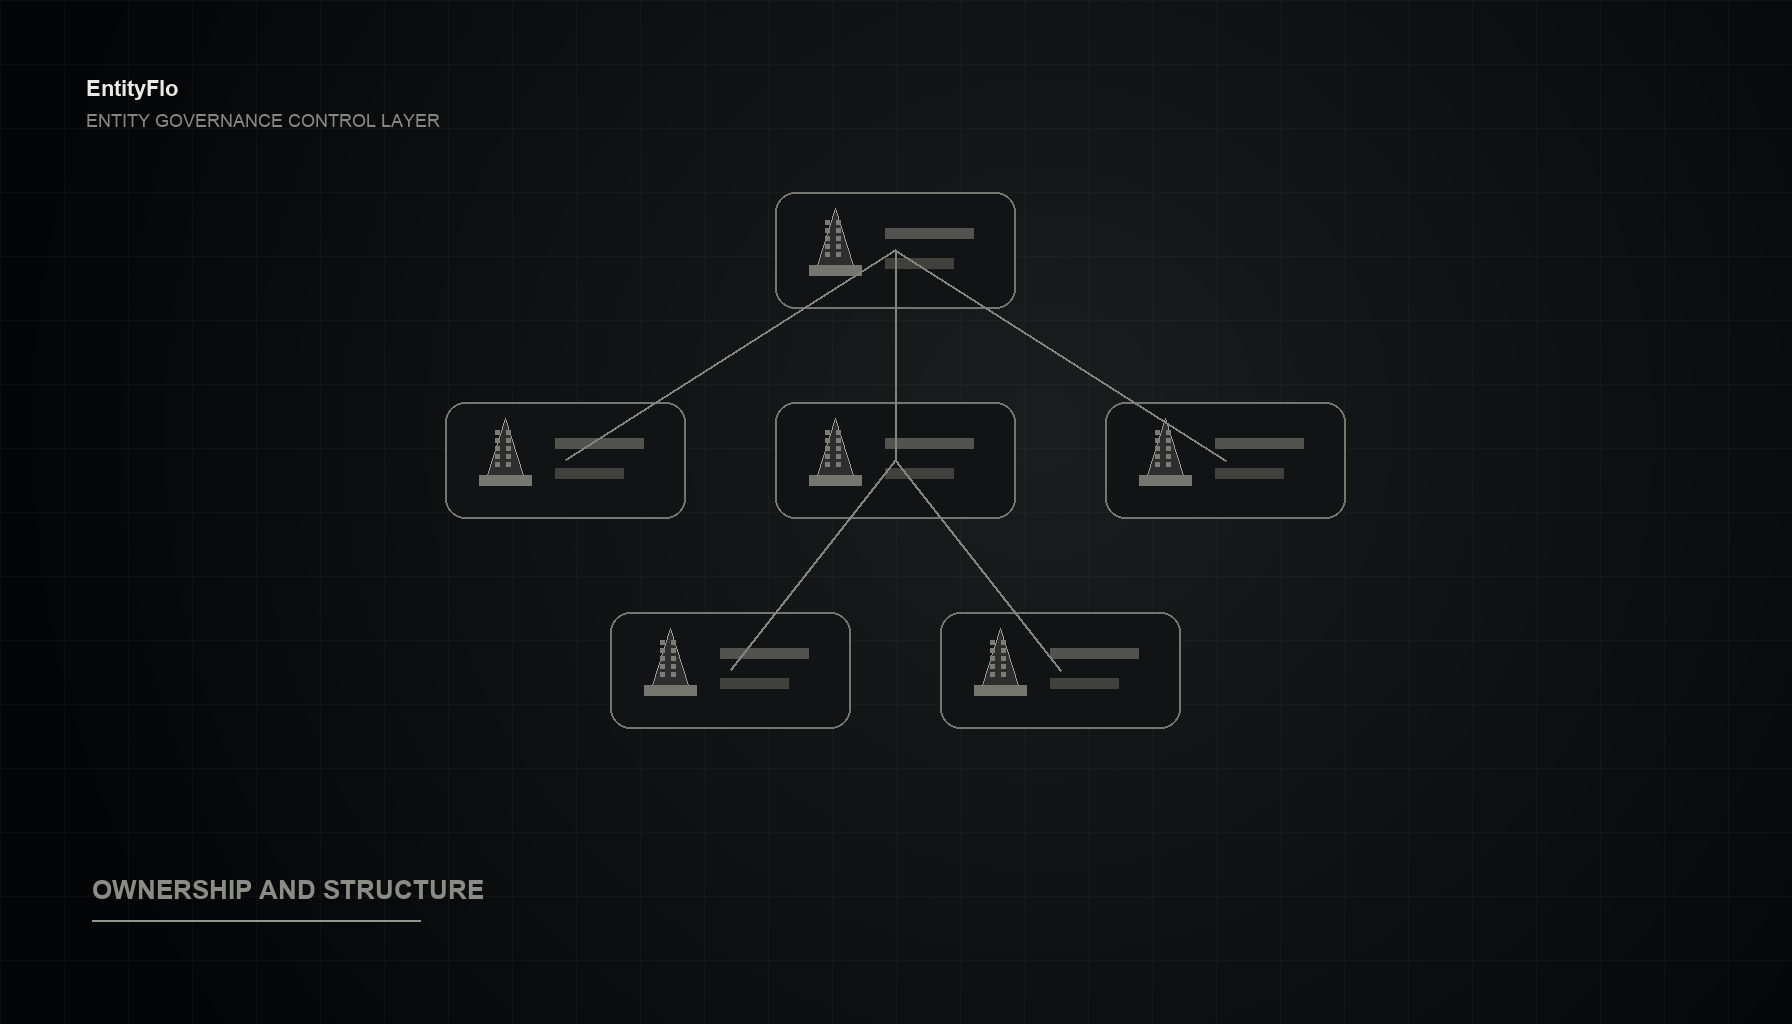
Corporate structure chart software Australia teams can rely on should do more than draw boxes. For a corporate group with operating companies, holding companies, trusts, SPVs, joint ventures, minority interests and changing officeholders, a structure chart is a governance record. It shows who owns what, who controls what, who sits where, and where the risk sits.
That record cannot live safely as a PowerPoint slide, spreadsheet tab or diagram file that someone updates when they remember. Static charts break as soon as there is a share transfer, new trustee, director change, acquisition, restructure or ASIC update.
EntityFlo gives Australian corporate groups a live structure chart generated from entity records, ownership data and ASIC-linked governance workflows. The chart is not a separate artefact. It is a visual layer over the same system that manages entities, registers, filings, approvals and board actions.
General information only, not legal advice.
What a Corporate Structure Chart Must Show in Australia
A useful corporate structure chart has to reflect how the group actually works, not just the simplified diagram used in a board pack.
For Australian corporate groups, that normally means showing:
- companies, registered bodies and foreign entities
- ACNs, ABNs and entity status where relevant
- holding companies and subsidiaries
- trusts, trustees, appointors and beneficiaries where tracked
- special purpose vehicles and project entities
- joint venture vehicles and minority interests
- share classes, ownership percentages and effective interests
- officeholders, including directors and company secretaries
- registered office and principal place of business where needed
- ultimate beneficial owner and control chains
- dates, evidence and audit history behind key changes
The details matter because different teams use the chart for different decisions.
A CFO may need to understand which entities sit under a financing group, which SPVs hold assets, and whether annual reviews or lodgements are outstanding. General Counsel may need to assess execution authority, control, related party exposure or due diligence readiness. A Company Secretary may need to confirm officeholders, registers, ASIC alignment and governance evidence before an action goes to the board.
One diagram rarely serves every purpose. Good entity structure chart software should let teams filter the same source record by ownership, control, jurisdiction, entity type, status, project, trust relationship or officer role.
The strongest charts answer practical questions fast:
- Which entities does this company own directly?
- Who ultimately controls this entity?
- Which trusts sit in the ownership chain?
- Which SPVs are dormant, active or under review?
- Which entities share a director or secretary?
- Which changes have been lodged, approved or are still pending?
- What evidence supports this ownership position?
If the chart cannot answer those questions, it is presentation material, not governance infrastructure.
Why Spreadsheet Org Charts and Static Diagrams Fail
Most corporate groups start with a static structure chart because it is easy. Someone creates a diagram in PowerPoint, Visio, Lucidchart, Miro or Excel. The chart is sent to lenders, auditors, investors, advisers or directors. A copy gets saved into a deal folder. Another copy is adapted for a board paper. Six months later nobody is sure which version is current.
The problem is not the drawing tool. The problem is that the chart is disconnected from the corporate record.
Static charts fail in predictable ways:
- New entities are incorporated but not added.
- Share transfers are completed but not reflected.
- Trust relationships are simplified or omitted.
- SPVs remain visible even after deregistration or dormancy.
- Joint venture interests are shown without rights or thresholds.
- UBO chains are manually calculated and not checked again.
- Officeholder changes are updated in ASIC but not in the chart.
- Multiple teams maintain conflicting versions.
- Evidence sits in email, not behind the chart.
For a group with 50 to 200+ entities, these issues compound. The finance team may have one version, legal another, the external registered agent another, and advisers another. Each version may be partially right. None is reliable.
The risk is false confidence. A clean chart can look authoritative while being wrong underneath.
That matters during:
- bank refinancing and lender KYC
- acquisitions and divestments
- internal restructures
- tax reviews
- solvency and board approval processes
- audit requests
- AUSTRAC or counterparty beneficial ownership checks
- director and officer onboarding
- corporate register clean-ups
When a chart is static, every request becomes a reconciliation exercise. The team has to cross-check ASIC records, registers, constitutions, trust deeds, share transfer documents, board approvals and email trails. That is slow, expensive and exposed to human error.
Live corporate structure chart software removes the separate-diagram problem. The chart updates from the entity data the team already governs.
What to Look for in Entity Structure Chart Software
The right software should give CFOs, General Counsel and Company Secretaries confidence that the structure chart is current, explainable and exportable.
At minimum, look for these capabilities.
Live Entity Data
The chart should be generated from structured entity records. If a company name, ACN, officer, shareholder, shareholding or status changes, the chart should reflect the current record without redrawing the group manually.
ASIC Alignment
For Australian companies, ASIC data is a critical reference point. Structure chart software should help the team align records with ASIC details, manage changes, and keep lodgement evidence attached to the relevant entity.
Ownership Percentages and Effective Interests
The software should handle direct and indirect ownership percentages. It should distinguish between legal ownership, beneficial ownership, voting rights and control indicators where the group tracks those concepts.
Trust Look-Through
Australian groups often use trusts, trustees and unit holding structures. A useful UBO structure chart Australia teams can rely on should not treat trusts as generic boxes. It should show the trustee relationship and support look-through analysis where data is available.
UBO Calculation and Control Paths
Manual beneficial ownership calculations are easy to get wrong in layered structures. The software should trace ownership through companies, trusts and other entities, calculate thresholds, and show the path from entity to ultimate beneficial owner.
Officeholder Visibility
Directors and secretaries are part of the governance picture. The chart should allow users to see which people hold office across the group and where changes are pending or historical.
Export and Audit Trail
Teams still need to send charts externally. Good software should export charts and reports while retaining an audit trail: what was exported, when, based on which record, and by whom.
Permissions and Approval Workflows
Not everyone should edit the corporate structure. The platform should support role-based access, review workflows and approval history so structure changes are controlled.
Comparison: Static Diagrams vs Live Structure Chart Software
| Requirement | Static diagrams and spreadsheets | Live corporate structure chart software | |
|---|---|---|---|
| Current entity data | Manual updates required | Generated from live records | |
| ASIC alignment | Separate check required | Connected to ASIC-linked workflows | |
| Trusts and SPVs | Often simplified | Modelled as structured entity relationships | |
| UBO chains | Manually calculated | Traced through ownership layers | |
| Officeholders | Usually omitted or stale | Visible from entity records | |
| Version control | Multiple copies circulate | One controlled source of truth | |
| Audit evidence | Stored separately | Linked to entities and changes | |
| External reporting | Easy to export but hard to trust | Exportable with traceable source data |
The difference is operational. Static diagrams are output. Live structure charts are infrastructure.
UBO Structure Charts Need More Than Ownership Lines
Beneficial ownership is where simple charts often break.
A normal corporate chart shows ownership from parent to subsidiary. A UBO chart needs to show how control or ownership flows through the structure to natural persons or controlling parties. That can include direct holdings, indirect holdings, trustee relationships, unit trust interests, nominee arrangements, voting control, shareholder agreements or other control indicators.
For Australian groups, UBO requests often arise from banks, counterparties, auditors, acquirers, funders, insurers, government procurement processes and AML/CTF reporting entities. The request is rarely just "send us a chart". It is usually:
- identify ultimate beneficial owners
- show the ownership chain
- provide supporting registers or extracts
- confirm percentages and thresholds
- explain trust or nominee relationships
- certify that the information is current
If the UBO analysis is maintained in a spreadsheet, every request forces the team to rebuild confidence. If it is embedded in the entity management system, the chart can show the chain and the underlying evidence.
That is why entity structure chart software should not stop at visual mapping. It should support governance data that makes the visual defensible.
How EntityFlo Generates Live Structure Charts
EntityFlo is built for Australian corporate groups that need one live system for entities, ASIC filings, registers, ownership, compliance, approvals and board actions.
In EntityFlo, structure charts are generated from governed entity records rather than drawn separately. The platform can bring together company details, ASIC-linked data, shareholdings, registers, trusts, SPVs, officeholders, documents and workflows into one operational record.
That means teams can use EntityFlo to:
- maintain a current register of companies, trusts, SPVs and related entities
- map parent, subsidiary, trustee, shareholder and joint venture relationships
- calculate and display ownership chains and UBO pathways
- support trust look-through where the relevant records are captured
- see officeholders across entities
- connect chart data to ASIC lodgements and governance actions
- export board-ready or counterparty-ready structure views
- keep an audit trail behind entity changes and chart outputs
The practical benefit is simple: the chart changes when the record changes. A new SPV, share transfer, director appointment, trust update or lodged ASIC change does not need to be manually redrawn in a separate file.
For CFOs, that means cleaner group reporting and faster due diligence. For General Counsel, it means stronger control over ownership, authority and evidence. For Company Secretaries, it means fewer version-control problems and a clearer path from decision to lodgement to record update.
EntityFlo replaces the spreadsheet-plus-inbox model with a live governance operations platform.
Book a Demo
If your corporate structure chart is still maintained in PowerPoint, Excel or a static diagram tool, it is probably carrying more risk than it shows.
EntityFlo gives Australian corporate groups a live way to manage entities, ASIC filings, registers, ownership, UBO chains, approvals and board actions in one place.
Book a demo with EntityFlo to see how live corporate structure chart software can replace stale diagrams with governed structure visibility.
We use cookies to improve your experience. Essential cookies are always active.