Structure & Ownership.
Where structure is mapped.
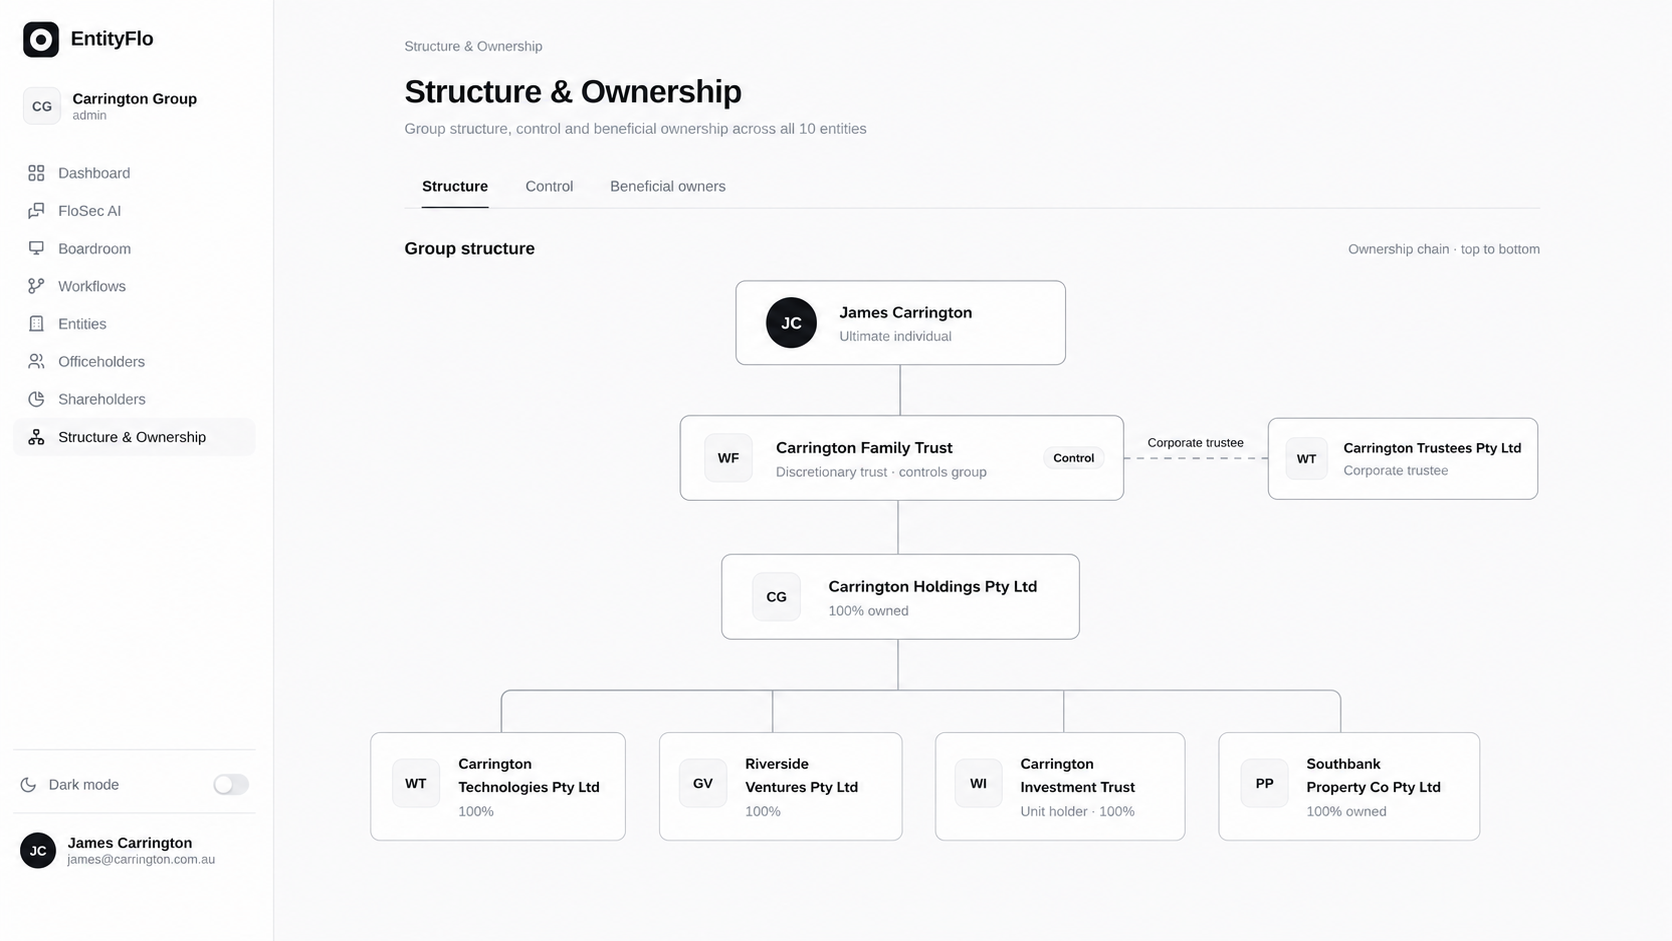
Your entire group mapped automatically — control, ownership and UBO traced through every layer. Ready when the bank, the regulator or the board asks.
Your first entity is free. No credit card required.
No one can draw the group from memory.
Structure charts live in PowerPoint, redrawn for each bank request and out of date the moment the next change happens. UBO thresholds get calculated by hand. Trust chains are guessed at. When the regulator asks, the answer takes weeks.
Charts redrawn for every request
PowerPoint structure charts get rebuilt for every bank, every audit, every funding round — none of them sync back to the corporate record.
UBO thresholds calculated by hand
25% beneficial ownership through layered holding structures takes spreadsheets, lawyers and weeks to confirm. Mistakes happen.
Trust chains lost in the deed
Trustees, appointors, beneficiaries and guardians sit in PDFs nobody re-reads. Look-through analysis takes a partner-level review every time.
Exposure invisible until it isn't
Concentration of ownership, control or exposure across the group is hidden — until the board, the regulator or the bank surfaces it.
One live map of the whole group.
Structure & Ownership builds the structure chart from the corporate record itself — and keeps it live. UBO is calculated automatically. Chains of control are traced through every layer. Exposure is visible at a glance.
Join BetaCharts that build themselves
Every share issue, transfer and entity change updates the structure chart in real time — no manual redraw, no version drift.
UBO calculated through every layer
Beneficial ownership thresholds (25%, 10%, custom) are calculated through holding structures, trusts and partnerships — automatically, with every supporting calculation traceable.
KYC pack on demand
When the bank asks, the beneficial ownership pack assembles in seconds — UBOs, supporting calculations, identity documents and certified copies, ready to send.
Chains of control, mapped
Voting control is mapped separately from economic ownership — so you see who controls what, even when the cap table says something different.
Trust mapping in full
Trustees, appointors, settlors, beneficiaries and guardians are mapped from the deed — and feed straight into UBO and KYC.
Inside Structure & Ownership.
The five capabilities that make structure & ownership work.
The rest of the platform.
Structure & Ownership connects to every other pillar — decisions flow, records sync, nothing lives alone.
Take control of your
entity portfolio.
Your first entity is free. No credit card, no lock-in. Set up in under 15 minutes.
Entity Register
Every entity, officer and shareholder in one live register.
ExploreGovernance Workflows
From board decision to registered outcome. Every step tracked.
ExploreCompliance Engine
Continuous compliance monitoring across every entity.
ExploreStructure & Ownership
Live structure charts, ownership chains and UBO traces across the group.
ExploreBoardroom
Run board meetings, papers, resolutions and minutes from one place.
ExploreFloSec AI
Your AI Company Secretary across every record, action and obligation.
ExploreWe use cookies to improve your experience. Essential cookies are always active. You can accept all cookies or choose essential only.