Structure & Ownership.
See every layer of ownership and control.
Map group structures, legal ownership, voting control, trusts and beneficial ownership from the same live entity data that drives governance work.
Your first entity is free. No credit card required.
No one can draw the group from memory.
Structure charts live in PowerPoint, redrawn for each bank request and out of date the moment the next change happens. UBO thresholds get calculated by hand. Trust chains are guessed at. When the regulator asks, the answer takes weeks.
Charts redrawn for every request
PowerPoint structure charts get rebuilt for every bank, every audit, every funding round: none of them sync back to the corporate record.
UBO thresholds calculated by hand
25% beneficial ownership through layered holding structures takes spreadsheets, lawyers and weeks to confirm. Mistakes happen.
Trust chains lost in the deed
Trustees, appointors, beneficiaries and guardians sit in PDFs nobody re-reads. Look-through analysis takes a partner-level review every time.
Exposure invisible until it isn't
Concentration of ownership, control or exposure across the group is hidden: until the board, the regulator or the bank surfaces it.
One AI-built map of the whole group.
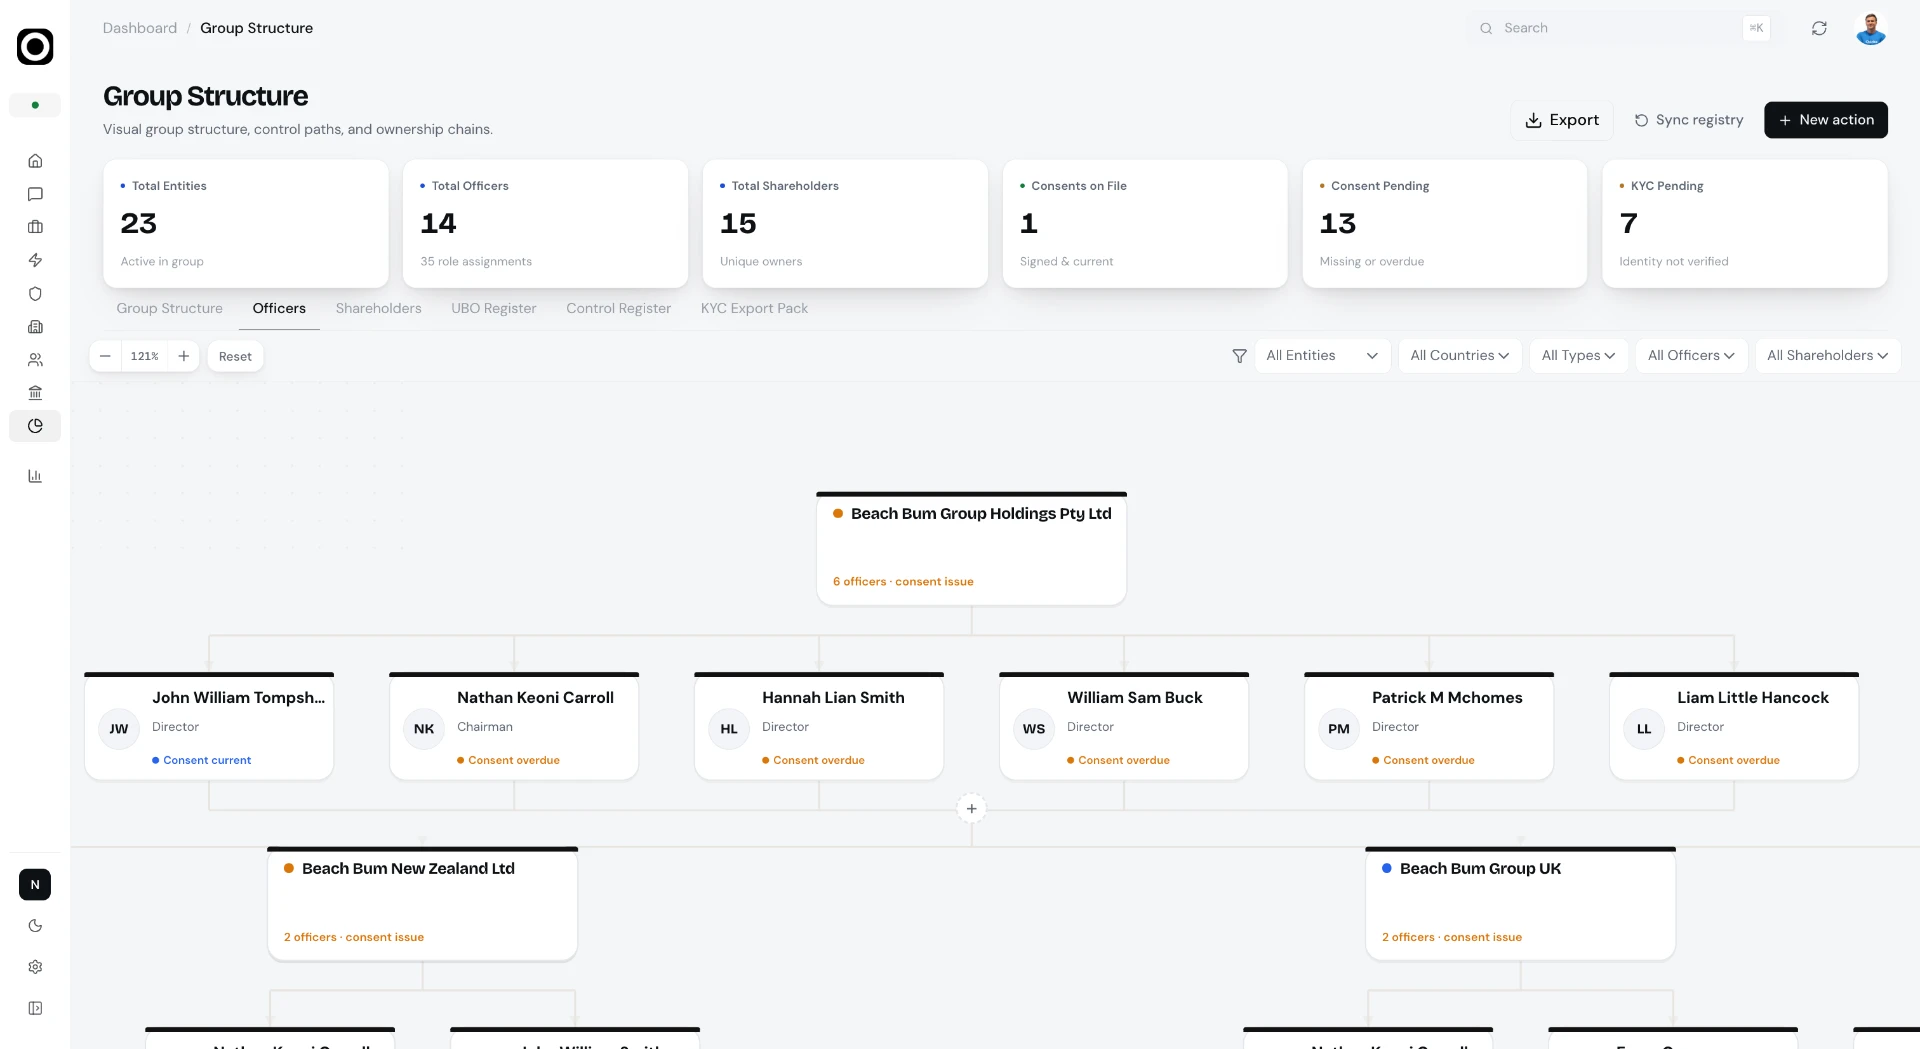
Structure & Ownership builds the structure chart from the corporate record itself, then AI keeps it live. UBO is calculated automatically. Chains of control are traced through every layer. Exposure is visible at a glance.
Book a DemoCharts that build themselves
Every share issue, transfer and entity change updates the structure chart in real time: no manual redraw, no version drift.
UBO calculated through every layer
Beneficial ownership thresholds (25%, 10%, custom) are calculated through holding structures, trusts and partnerships: automatically, with every supporting calculation traceable.
KYC pack on demand
When the bank asks, the beneficial ownership pack assembles in seconds: UBOs, supporting calculations, identity documents and certified copies, ready to send.
Chains of control, mapped
Voting control is mapped separately from economic ownership: so you see who controls what, even when the cap table says something different.
Trust mapping in full
Trustees, appointors, settlors, beneficiaries and guardians are mapped from the deed: and feed straight into UBO and KYC.
Inside Structure & Ownership.
The capabilities that make structure & ownership work.
Beneficial Ownership Map
UBO thresholds traced through every layer: with the supporting calculations and a KYC pack ready on demand.
Multi-layer look-through
Beneficial ownership is calculated through any depth of holding companies, trusts and partnerships: multiplying through chains automatically.
Multiple thresholds, side by side
25% (AUSTRAC), 10% (some regulators), custom thresholds (some banks): all calculated and surfaced in parallel, with every step shown.
KYC pack on demand
The bank-ready pack assembles in one click: UBO summary, supporting calculations, identity documents and certified copies: logged against the requester and date.
Chains of Control
Who controls what, through which entities: voting control mapped separately from economic ownership.
Control is not ownership
A director-controlled trustee, a class of voting-only shares, a trust appointor: voting control is calculated separately from economic ownership and shown side by side.
Through every layer
Control is traced through layered structures so the ultimate controller is visible even when the cap table hides it.
Audit-ready chain of evidence
Every chain is supported by the constitution, the shareholders' agreement or the trust deed it derives from: clickable, citable.
Exposure Mapping
Group-wide visibility of risk and concentration: for the board, the auditor and the bank.
Concentration at a glance
See ownership concentration, jurisdictional exposure and sector exposure across the entire group in one view.
Drill from the heat-map to the entity
Click any exposure tile and drill straight through to the entity, the cap table and the underlying agreements.
Board-ready visuals
Exposure visualisations export directly to the board pack: same data, same source, no re-creation in PowerPoint.
The rest of the platform.
Structure & Ownership connects to every other pillar: decisions flow, records sync, nothing lives alone.
Take control of your
entity portfolio.
Your first entity is free. No credit card, no lock-in. Set up in under 15 minutes.
We use cookies to improve your experience. Essential cookies are always active.